
Google Analytics – You might haven’t heard about this tool or might be wondering what this tool is and how to use it. Then this guide is for you.
This Analytic tool is wonderful. However, many websites are not fully using Google Analytics to measure and monitor their traffic. This guide will tell you everything about Google Analytics, from its setup to how to make it your weapon and generate traffic and even conversion on your website.
Google Analytics can be immense help as it gives an evident understanding of your website traffic so that you can know what measure you should do to improve the performance of your site and to ensure that your visitors get converted into leads.
How can you Leverage Google Analytics
If you have a website, whether it’s for your business or personal use, then you must install Google Analytics. We will tell you right here what you can do with Google Analytics.
- You can check how many people visit your website.
- Channels from which you are getting traffic.
- Are you getting Organic searches from SEO?
- What pages of your website get the most organic search?
- What marketing strategies to drive traffic to your website?
- Which pages are the least performing?
- Know about your visitors, what cities are they from, what’s their gender, age, and so on?
- What pages have the worst click-through rate, bounce rate, and load time?
- Which pages have the best conversion rate?
- Know how many visitors have converted into leads?
- Improve your website’s speed.
There are so many things that Google Analytics can do for your website, but these are the important ones that everyone wants to know.
The best part is Google Analytics is a completely free web analytics tool by Google. It helps you in evaluating your site’s traffic, performance, and gather valuable information about your website visitors. GA (Google Analytics) can give you the answers to the questions mentioned above and enable you to see how your website is performing virtually.
Google Analytics is available in two additional versions one is subscription-based GA 360 which targeted for enterprise users, and the other one is Google Analytics for mobile applications which is an SDK, it allows you to gather usage data from your Android and iOS app.
GA provides you a clear picture of what modifications you should implement to improve your site and maximize your conversions.
Google Analytics is pretty adequate for most of the companies as well as for users unless your traffic is super huge and your website structure and tracking need to be super complicated. If you want to know more about the difference between GA and GA 360, Please Check Here!
This tool is entirely free of charge. With the help of Google Analytics, you can be sure that it will make your every online marketing campaign result in benefits that will improve your business’s Return of Investment.
Now let’s have a glance at how you can get everything done with the help of Google Analytics.
Step 1: How to install Google Analytics?
For the installation of Google Analytics, you need to create a Google Analytics account. You can create this by using a primary Google account that you use for other Google services, or you can also create a new Gmail account for your business.
But note that the mail id you use that should be the Google account you plan to keep and only you should have access.
If you have created the account, then go back to the Google Analytics page and then click Sign In. It will automatically take your Gmail, and then you need to enter your password to continue. Now do click on the ‘Sign-up’ button.
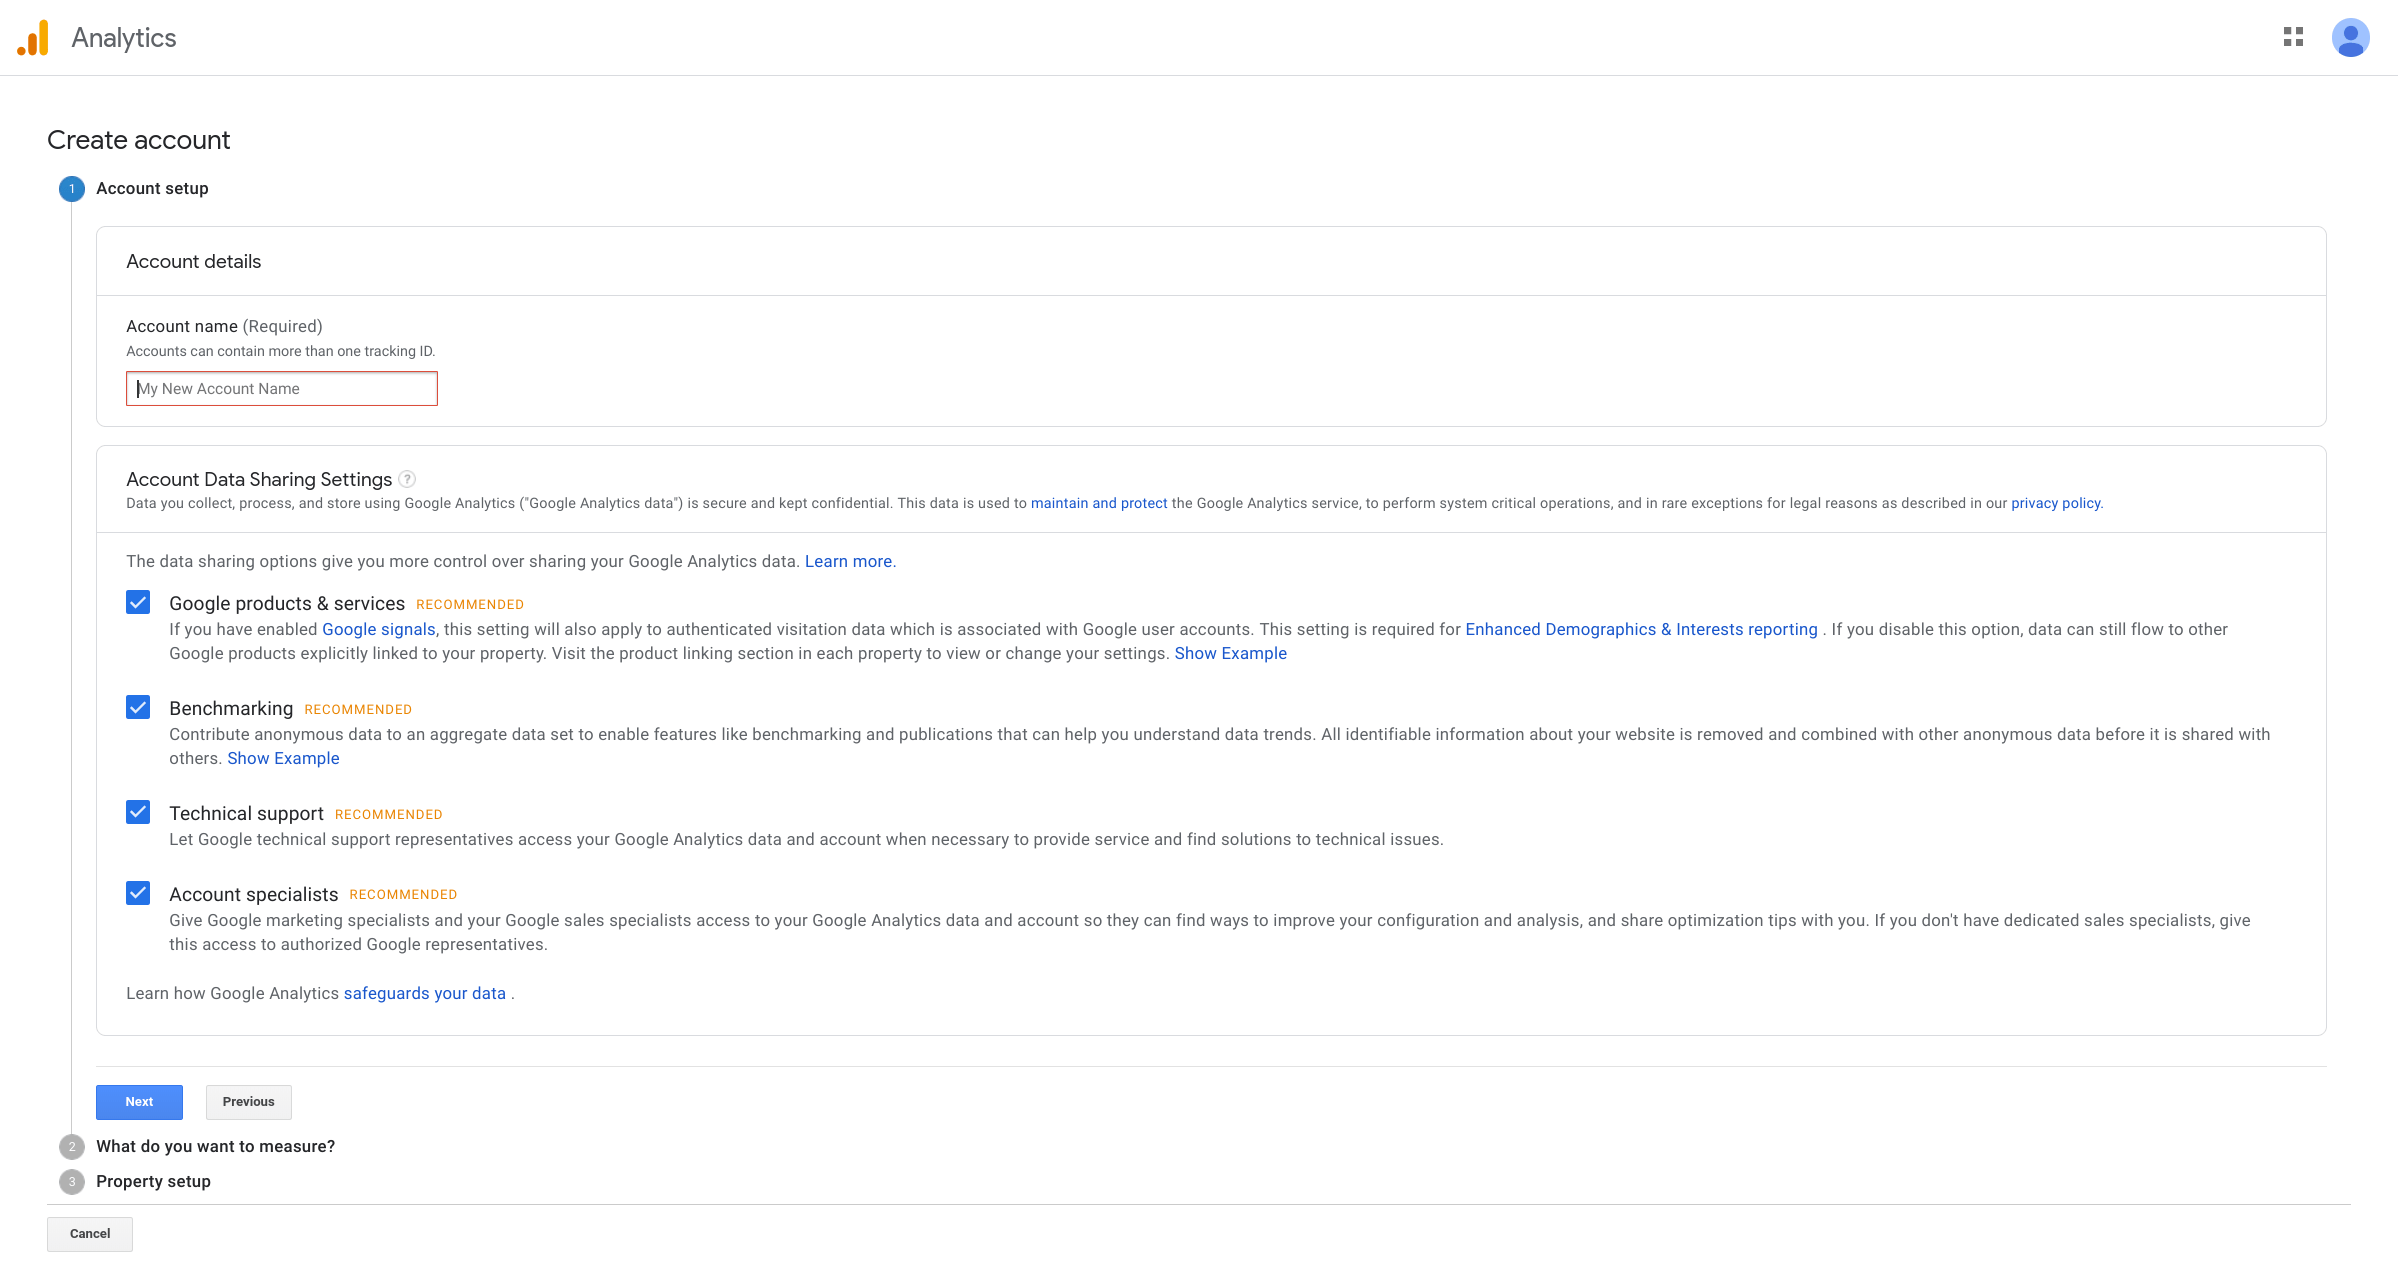
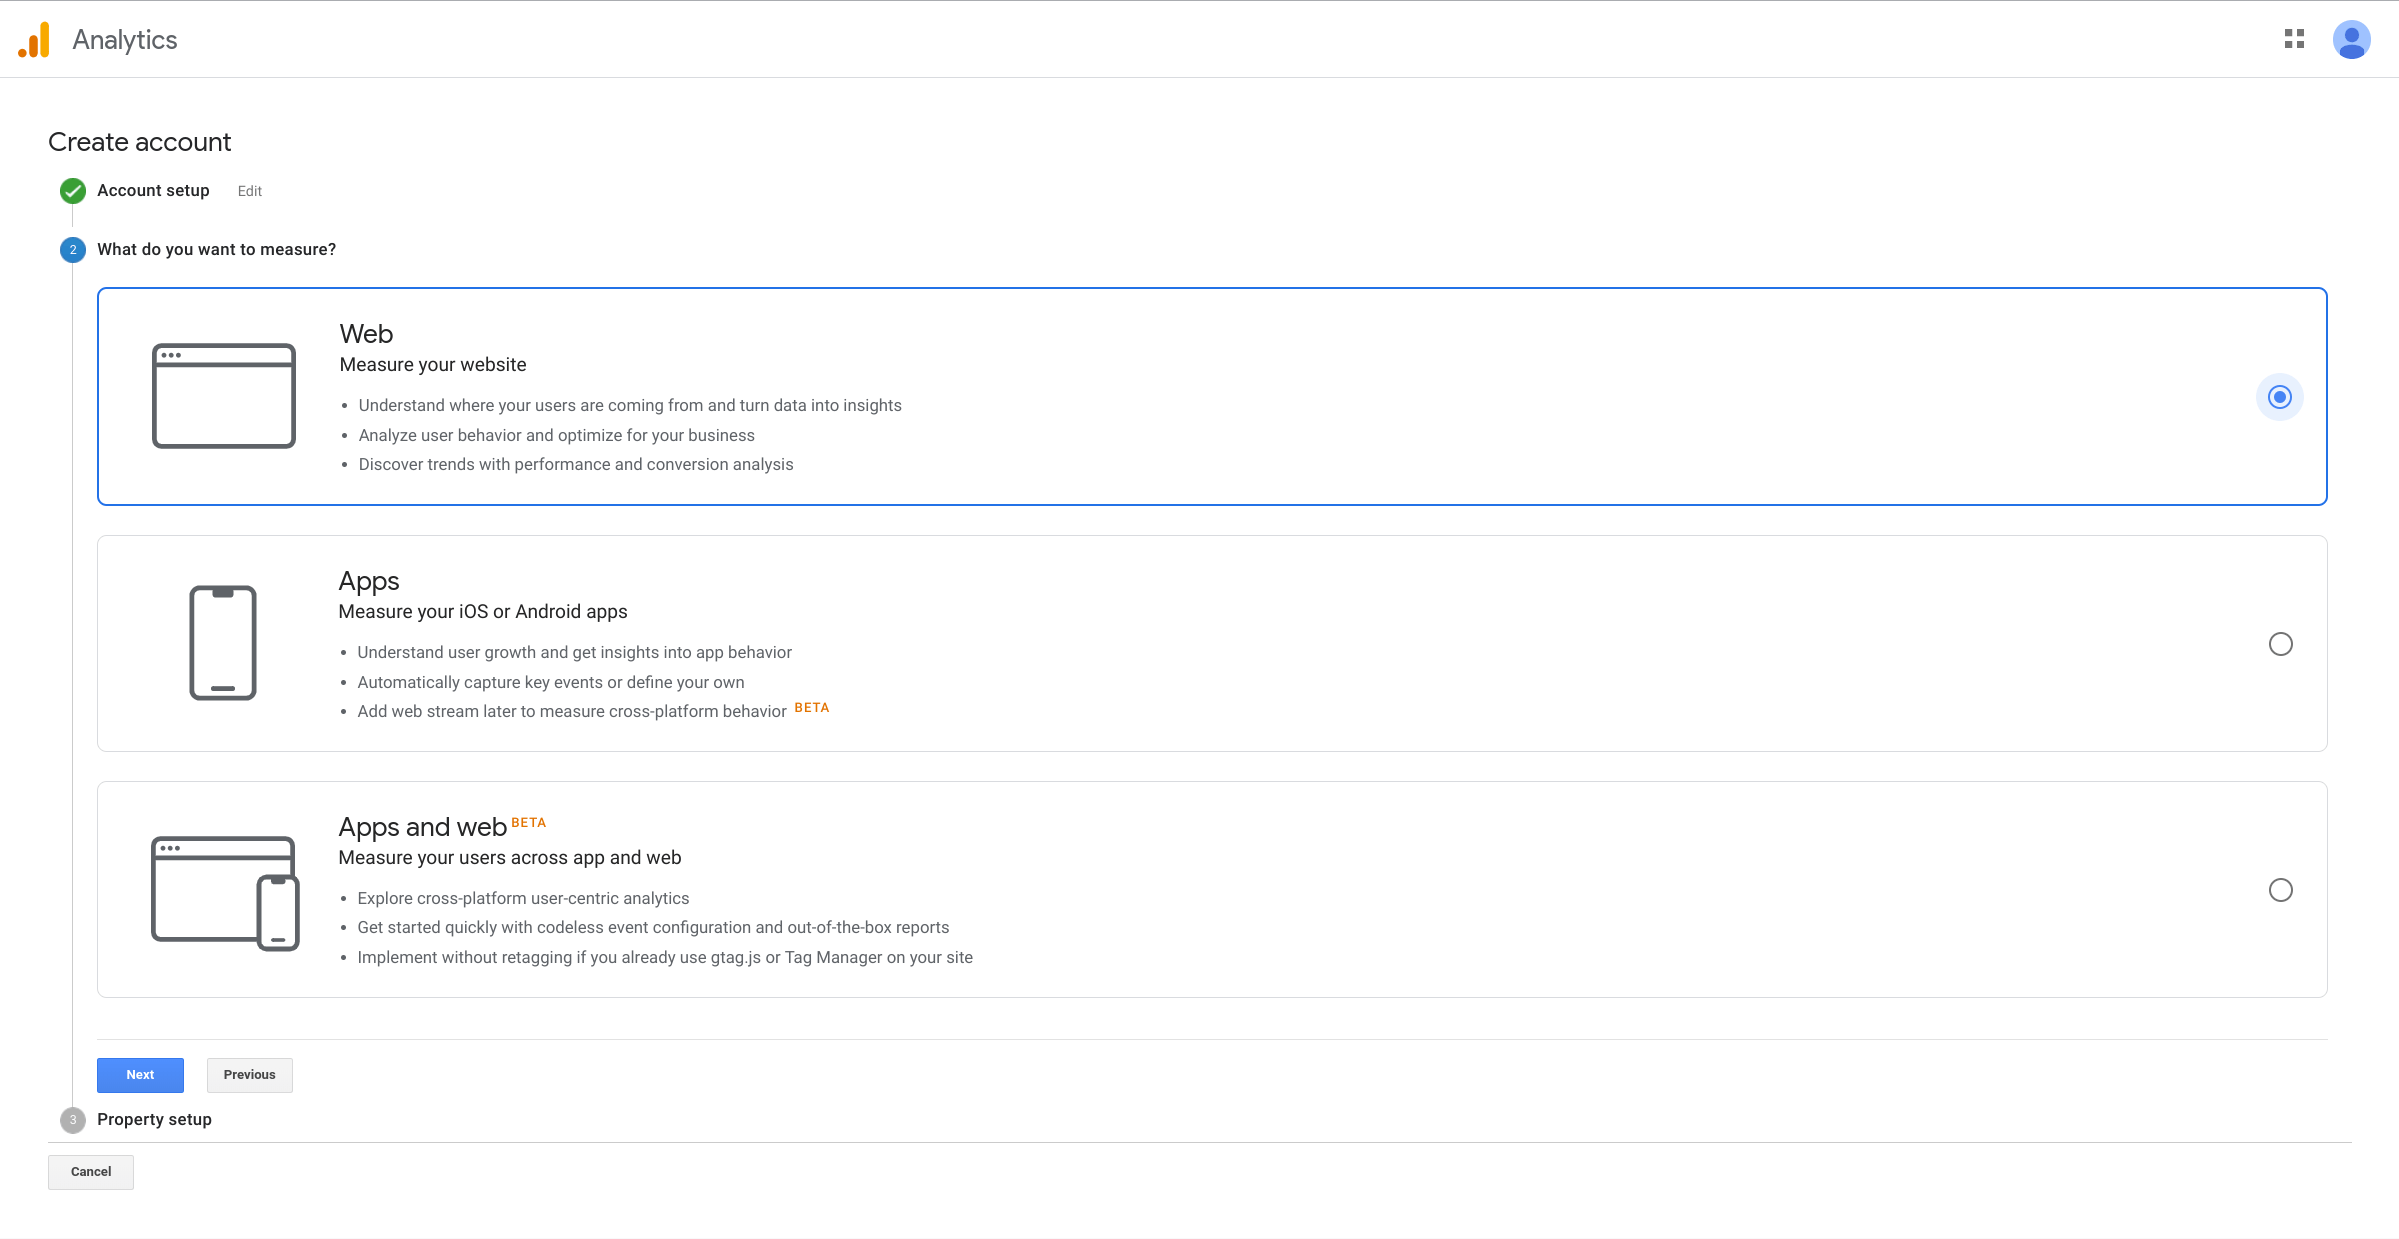
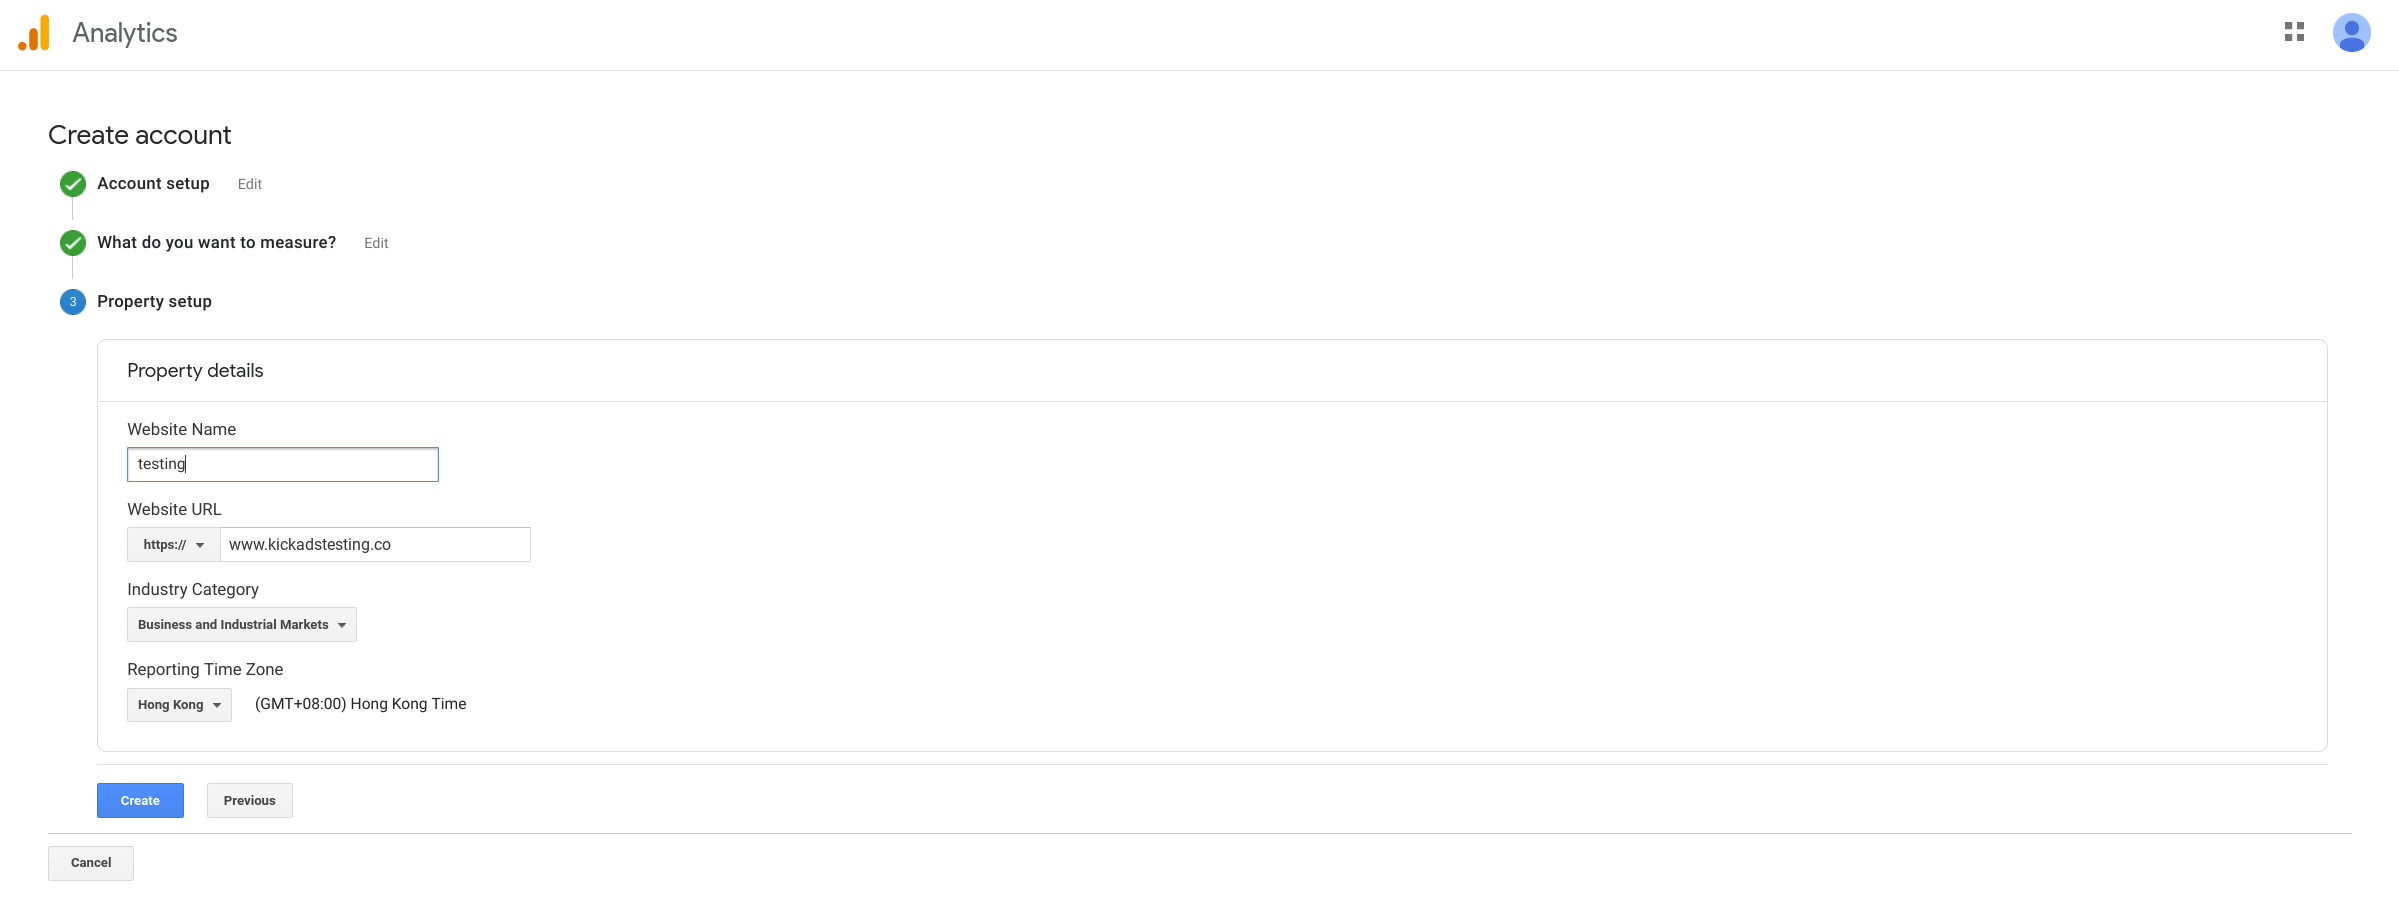
 Now, this another page will ask you the information about your business whether you want Google Analytics for a website or application. Enter the information about your website, account name, website name, website’s URL, industry type, time zone, etc. After filling all the information, click on the ‘Get Tracking ID’ button.
It will redirect you to the terms of the services page of Google Analytics, click on the below checkbox and then ‘I Accept’ button.
This page will take you to the homepage of Google Analytics account where you will see the ‘Tracking Code’ page that shows your ‘Tracking ID.’
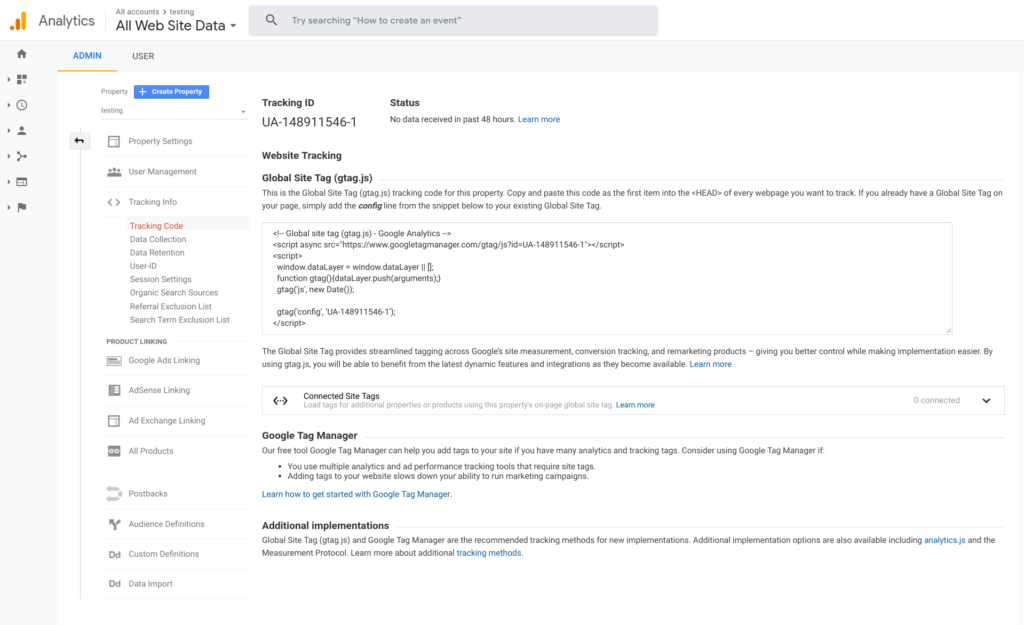
You can add this tracking code to your WordPress to add Google Analytics to your website.
Step 2: Insert Google Analytics to WordPress/Shopify & Others.
You have to install it on every page on your website. For WordPress website using the Genesis Framework, it has a specific area named as header and footer scripts where you can add this code.
You can also use Google Analytics by Yoast plugin to install the code easily on your website no matter what framework you are using.
In case if you have a website developed in HTML, then you can add this tracking code before </head> tag on each page of the website.
Alternatively, if you have a Shopify eCommerce store, then you need to go to your Online Store tab and have to paste the code where defined as Google Analytics Account.
Learn More: Setting up Google Analytics in Shopify
The installation of Google Analytics varies as per the platform. So do remember to check your platform and the installation process. (Leverage Google Search to find out your solution!!)
Step 3: Goal Set-Up
After installing the tracking code on the website, you need to configure settings into your website’s profile on Google Analytics. This is also termed as Goal setting. You will be able to find it on the Admin link and then click Goals under the website’s View column.
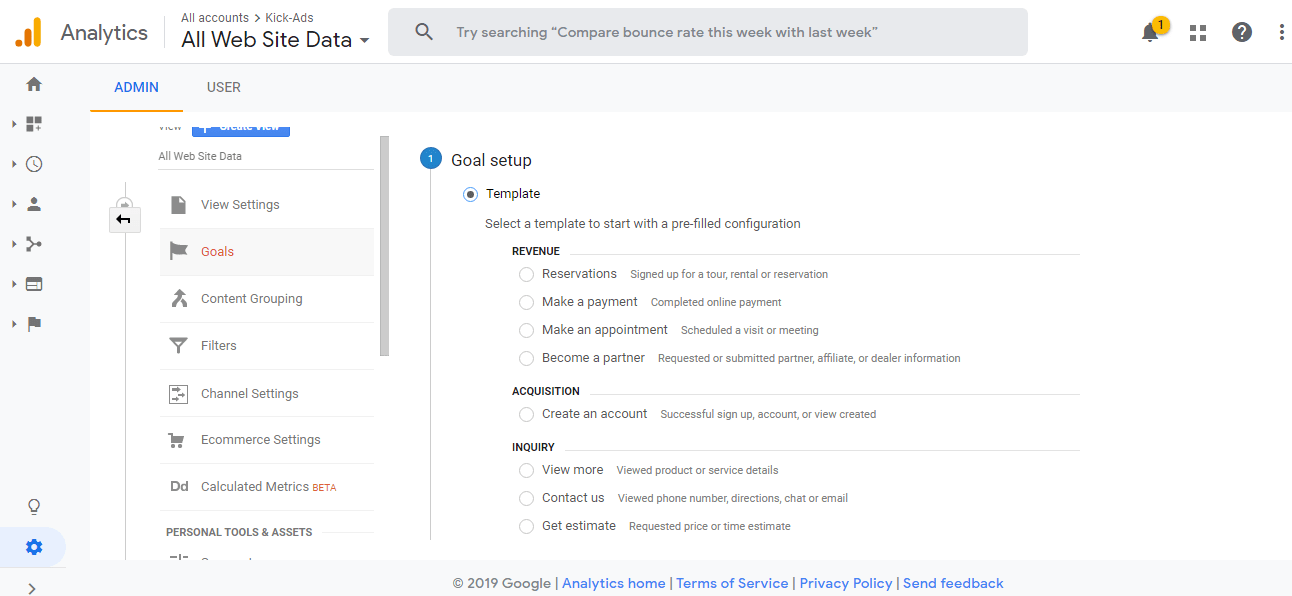
Goal setup is a must for every website no matter if it is an eCommerce website or a blog website. Because if you don’t set up your goal, you never know if the traffic is bringing you any business value or not.
For an eCommerce website, you may want to know the number of transactions.
For the Business website, you may want to track the number of Form Submissions.
Or for Media website or Blog websites, you may want to know the time duration or the number of pages users visit.
So you should ask yourself, what goal you want to track, and what goal can directly bring conversion value?
Goals calculate how many users have filled your contact form, subscribed to your services, download your resources, and other target objectives. It will notify you when something happens on your website.
Add a destination URL that a user can see after completing the goal such as a thank you page or a confirmation page.
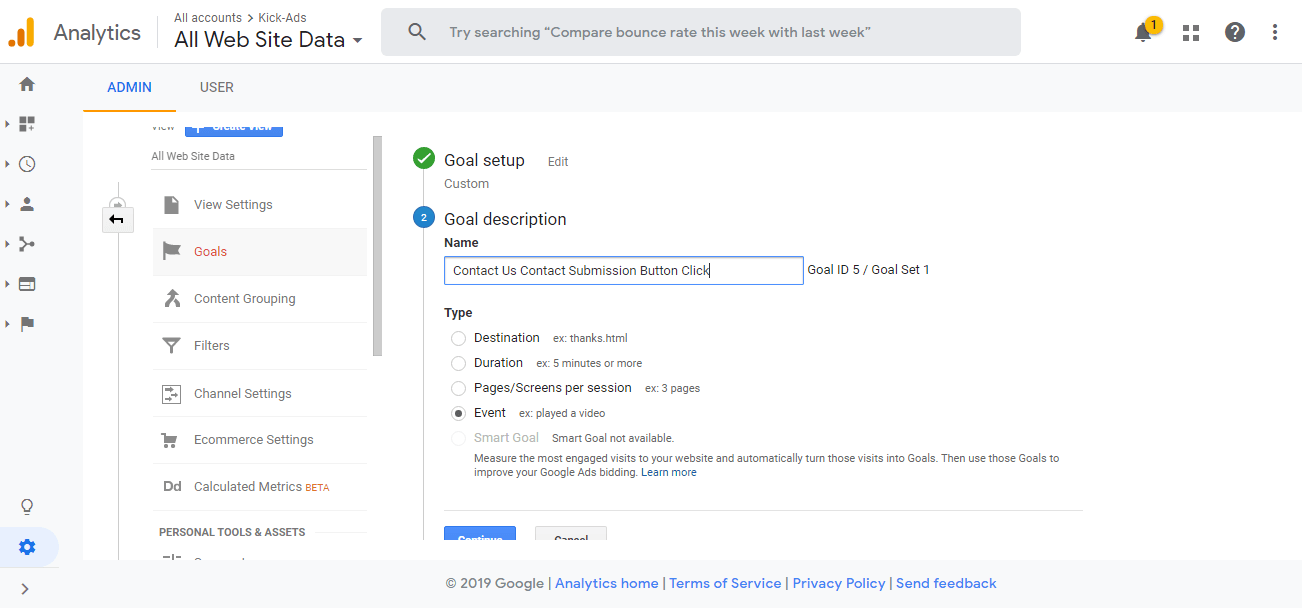
These goals will notify you whenever a specified activity will be triggered and will provide you a detailed report.
For instance, if you have an eCommerce website, then you must have a confirmation page such as Thank you page on which your users will land after completing a purchase.
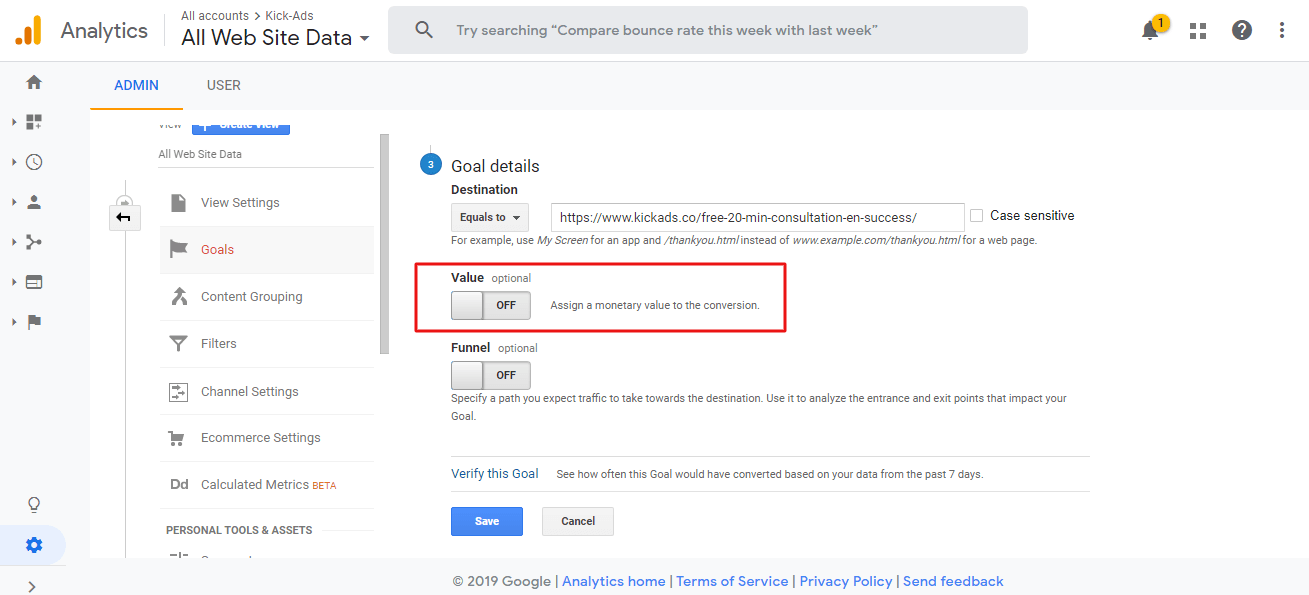
Now toggle the value and enter a specific amount for your conversion, it is optional, and then click the Create Goal to complete the setup.
If you have other similar goals that you would like to track on your website, you can follow these steps and can create up to 20 goals on your website. Make sure that you focus on important goals that can benefit your business. These goals cover lead forms, order completion, and email sign-ups, depending on your website purpose. Your goals can be different as per your business requirements.
Goal Tracking could be very powerful, for example, you can track the number of clicks, element visibility change, website scroll down percentage, etc. We will talk over it in the near future, so wait for our next guide. In this article, you will be able to know how you can track overall traffic and can get an idea of how to use your marketing tactics to get fruitful results. This is just the basics of Google Analytics.
This is considered as the simplest conversion tracking in Google Analytics.
Step 3 (Bonus): Enable E-Commerce Setting
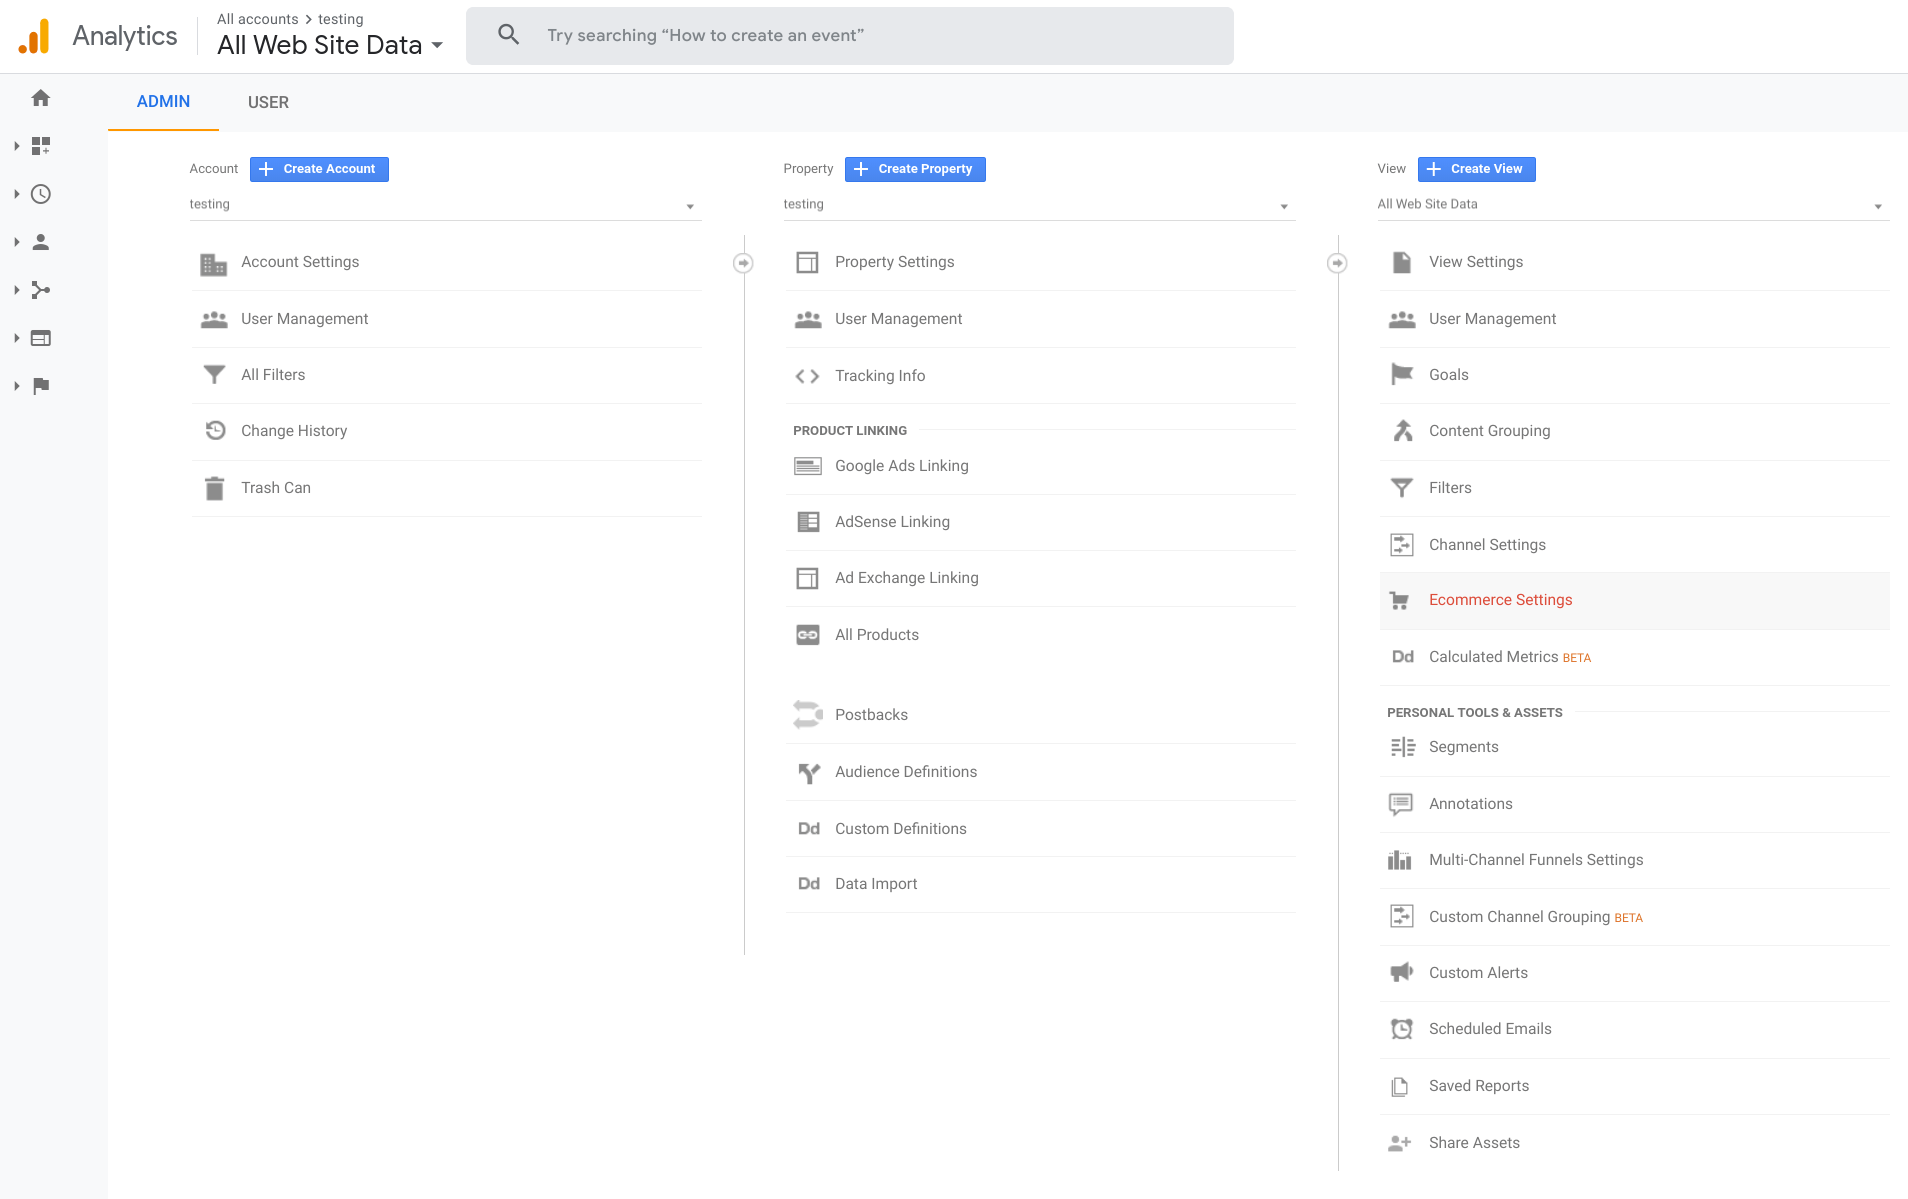
If you own an eCommerce store, then you must want to know how to track Conversion Value at Goal Setting? Don’t worry; we have got your back. If you are using an eCommerce platform such as Shopify, Squarespace, or Shopline. I guess most of you will use such eCommerce platforms instead of developing your website from scratch in HTML5. To set-up, this, go to Admin then choose the eCommerce setting.
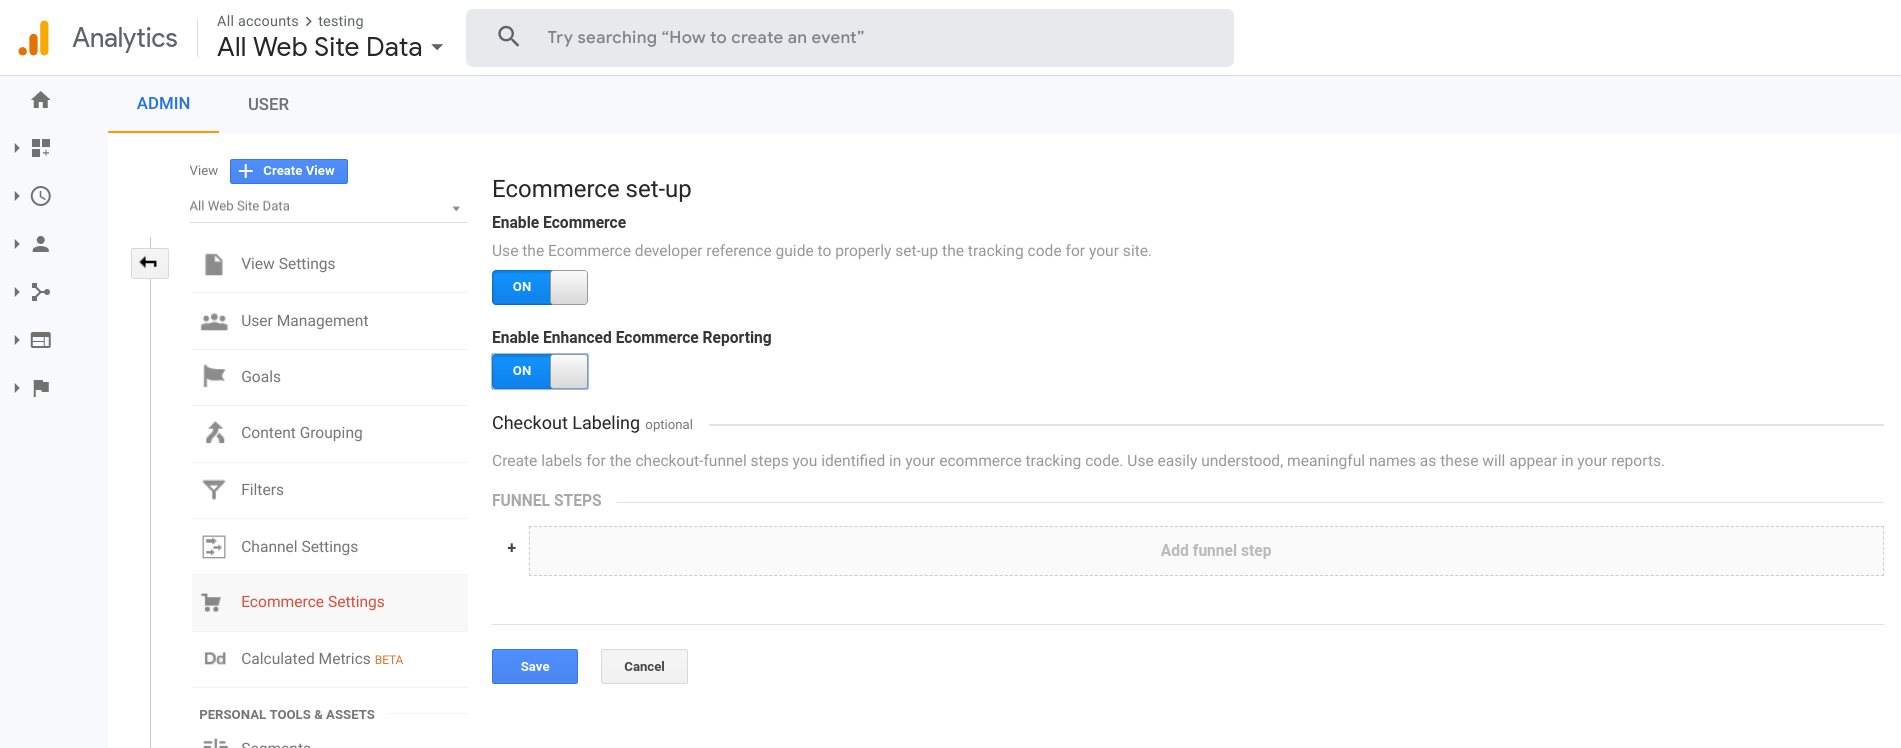
Enable eCommerce and Enable Enhanced eCommerce Setting.
The most important reason why you need this is that you can automatically view your Conversion Value (Transaction Value) by turning this on.
Step 4: Setting Goal Funnel
Goal funnels are very valuable for business purposes. It contains a particular series of steps required to make an action on the website. All types of businesses can use goals and funnels to track micro-conversions.
Setting funnel helps you see how many users make it to the next step to the conversion goal and how it may drop off in between. This will allow you to see if a lot of people are leaving in between the conversion process on a specific point. Then you should find out to see what is pushing this high drop rate.
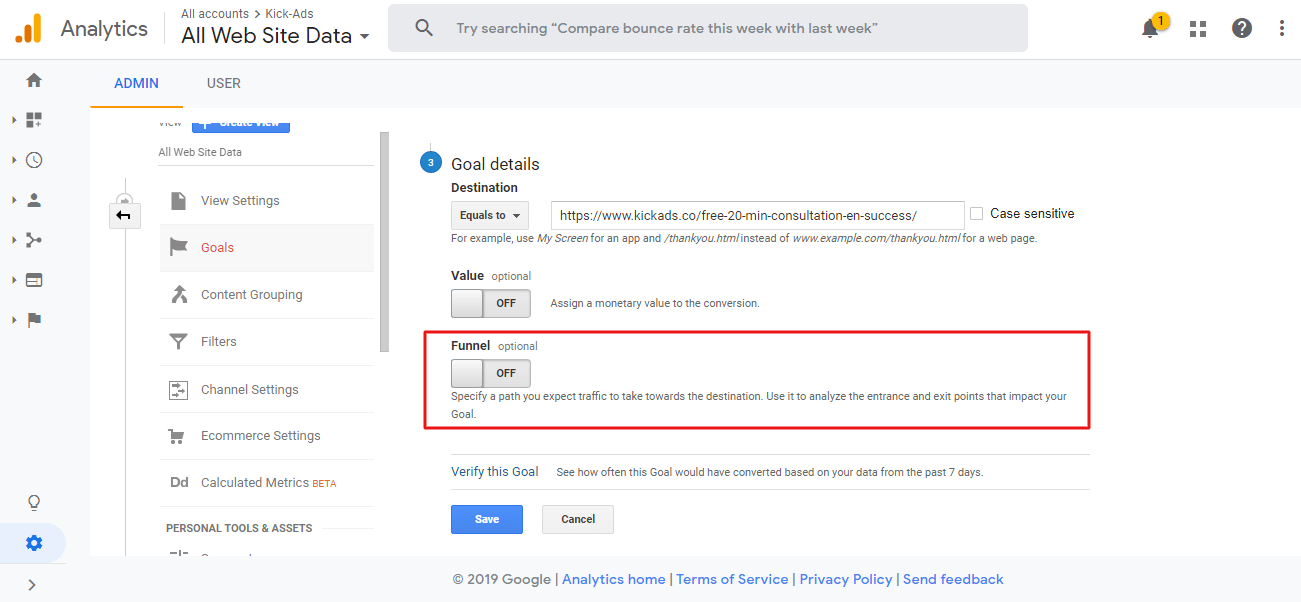
Toggle the switch ‘On’ to set up the pages of the funnel. Each step represents a web page that your website users must pass through to reach your goal.
Learn more about Goal Funnel Setup: https://conversionxl.com/blog/funnels-google-analytics/
Step 5: How can you get traffic information with GA?
You can find traffic information on the ‘Home Page’ of Google Analytics. When you log in to your Google Analytics account, this is the first page you see. Click the ‘HOME’ button on the left side, and you will be able to see your Google Analytics Home.
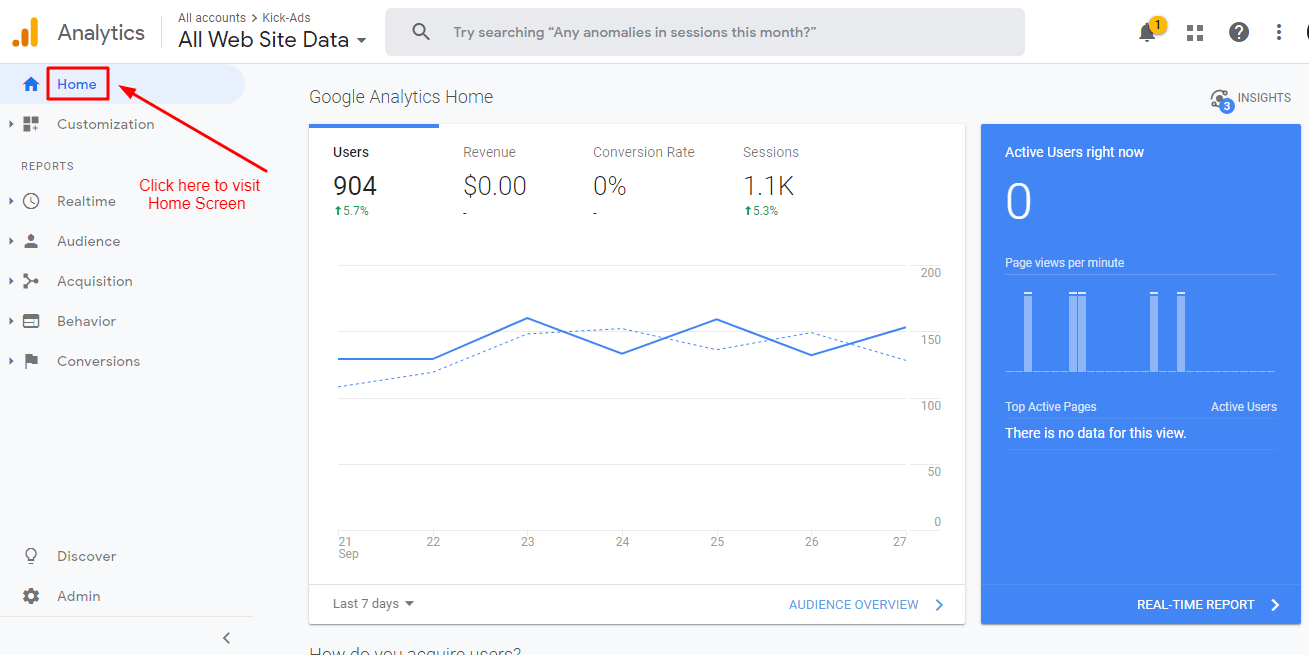
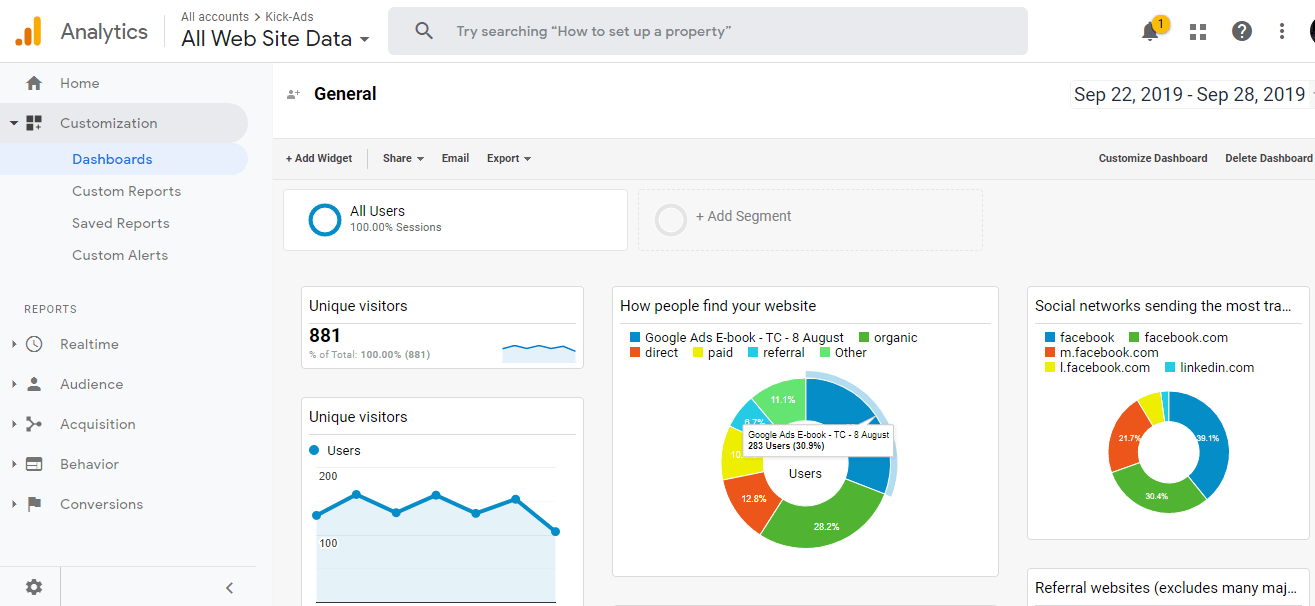
This dashboard shows you traffic for the last seven days, what time people are most likely to visit your site and how many people are on your website at the moment.
Scroll down a little, and you will see information from where people are coming from when they visit your website. You will also see the means from which you are getting traffic, i.e., ‘Direct,’ ‘Social Media,’ ,’Organic’,’ Referral’ and ‘Other.’ It will also show you which countries people are coming.
Scroll a little more, and you’ll see the most popular pages amongst users, how many active users you have had over time and from what type of devices people come to your website.
You can see how many people come back to your website in the last section, i.e., user retention.
The dashboard gives you all the information you want to know about your website’s traffic. You can dive deeper into the information and can take benefit.
Feel free to change the time frame such as today, yesterday, last seven days, last 28 days, and the previous 90 days as you want.
Also, You can also customize the time range to see the traffic during that time by clicking on ‘Custom.’
Further to deep dive to collect the information click on Audience Overview, it will give you a broad view of your traffic.
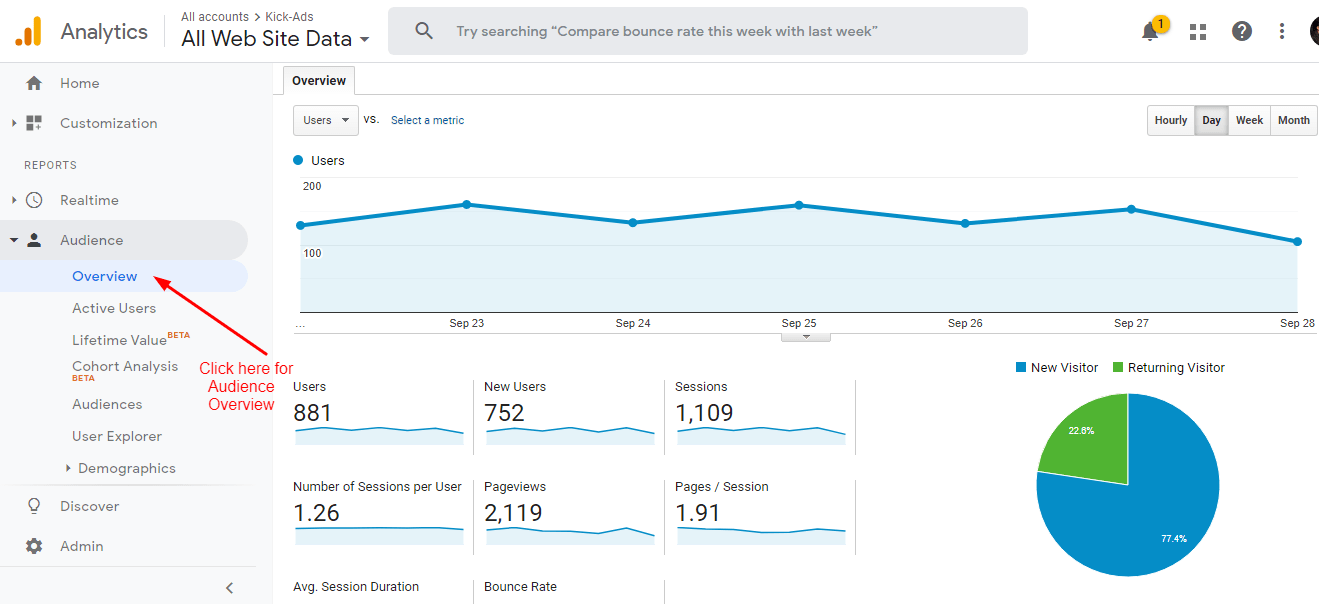
Here you will see traffic numbers that you are getting hourly, daily, weekly, and monthly. You can check how many sessions you users have had, your page views, average session duration, number of people return to your website, and bounce rate.
You will also learn about the demographics of your traffic here. Just click on
- Language
- Country
- City
- Browser
- Operating System (Desktop)
- Service provider (Desktop)
- Operating System (Mobile)
- Service Provider (Mobile)
- Screen Resolution (Mobile)
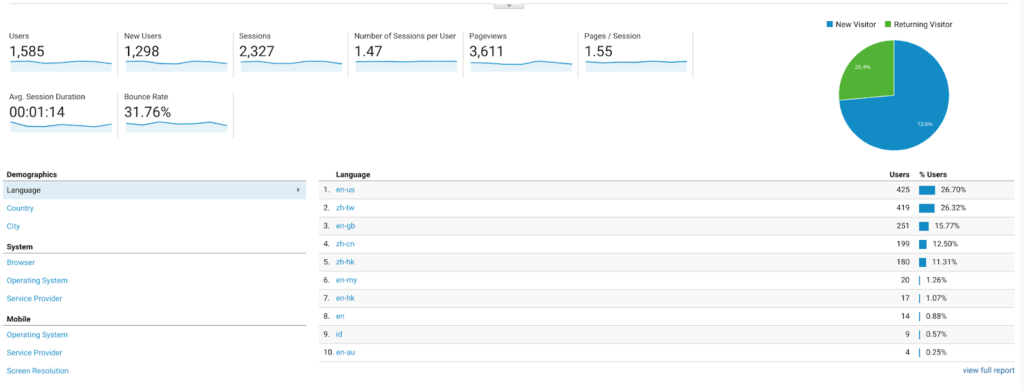
You will be able to see the language your users use on the right, which can help you decide whether you should include content in different languages or should enable translators on your website.
Now let’s move to demographics to learn more about your user’s behavior.
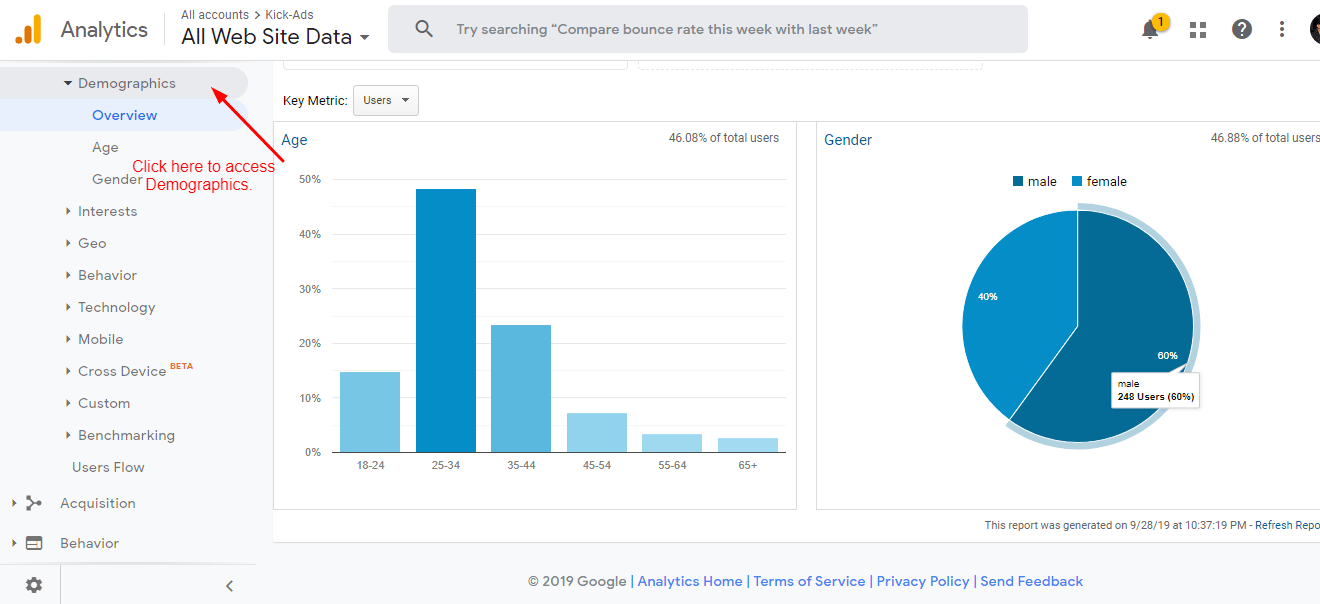
Step 6: Track your user’s behavior demographically
After checking the traffic information in Google Analytics, you can learn about your visitors even more in the demographics. You can see the demographic section on the left side. On clicking it, it will show you three drop-down options Overview, Gender, and Age. By identifying this, you can analyze whether you are targeting the right audience or not.
You can also understand your user’s interests, know their location and behavior on the site.
To know your users’ interest, you can customize your creative and copy to attract those customers, and you can also take reference from here to finetune your targeting at your Google Ads Targeting, and even for facebook.
On clicking these tabs, you will be able to see how many people visited your site for which interest, where they came from, and what action they have performed on your website.
Knowing about your visitors is very important to improve your website’s reach and traffic.
Step 7: What can you learn from your user’s behavior?
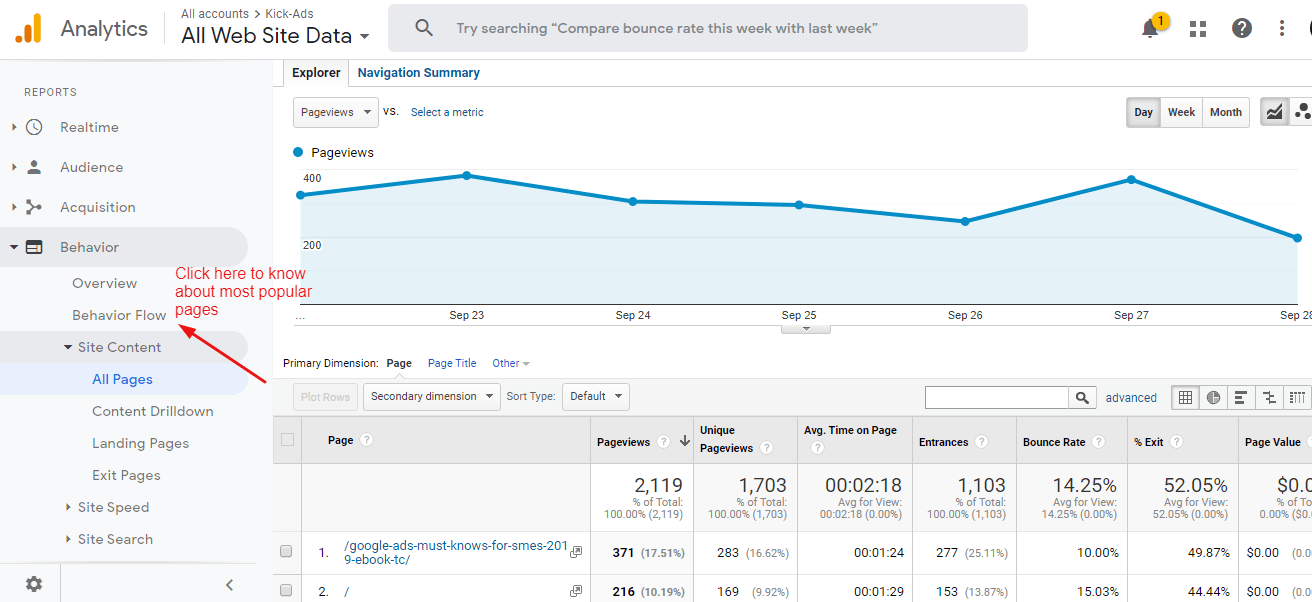
To customize your site to fulfill the needs of your users, you should also examine the Behaviour data on Google Analytics.
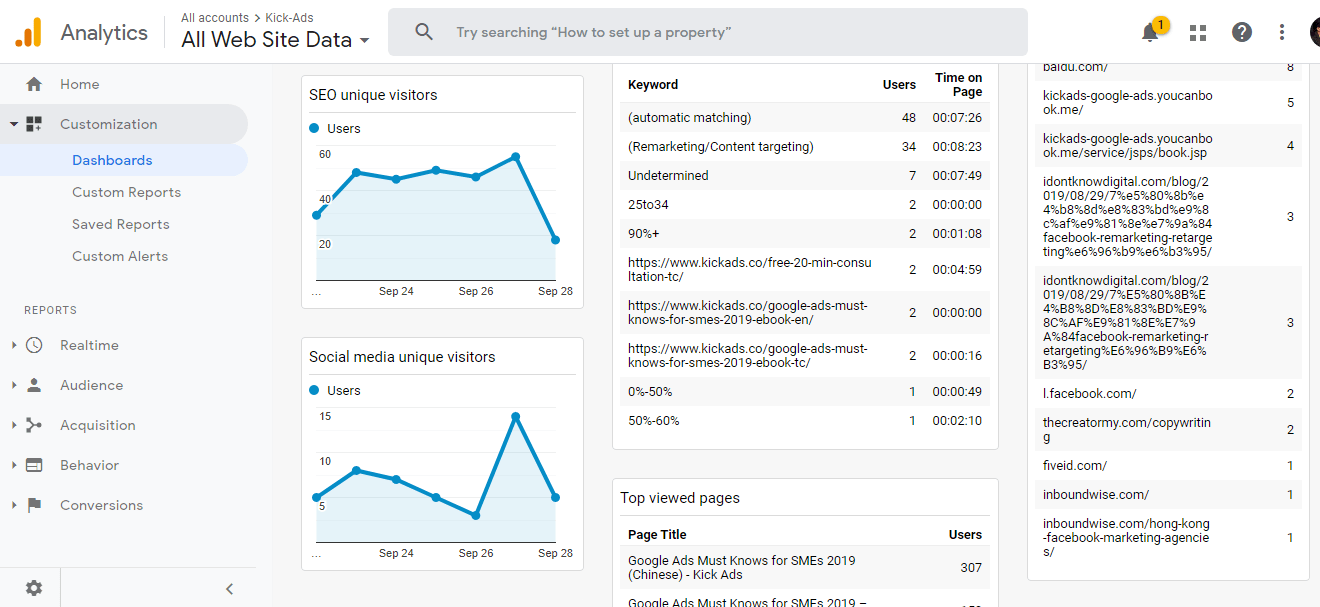
It gives you an idea of which pieces of content are most popular on your site. You simply have to click on the behavior and then go on Site Content. To see the list of pages people have visited click on All Pages. The most popular ones are listed on the top.
Now click on Landing pages to check how well your landing page is performing. It will tell you whether your landing page has been effective in converting users into leads.
Do check the Exit Pages to know which pages your users abandon. You can use this information to save your users. Analyze the reason and what is missing that your users are looking for, or you should make something attractive, and give exclusive offers to your users to help them stay.
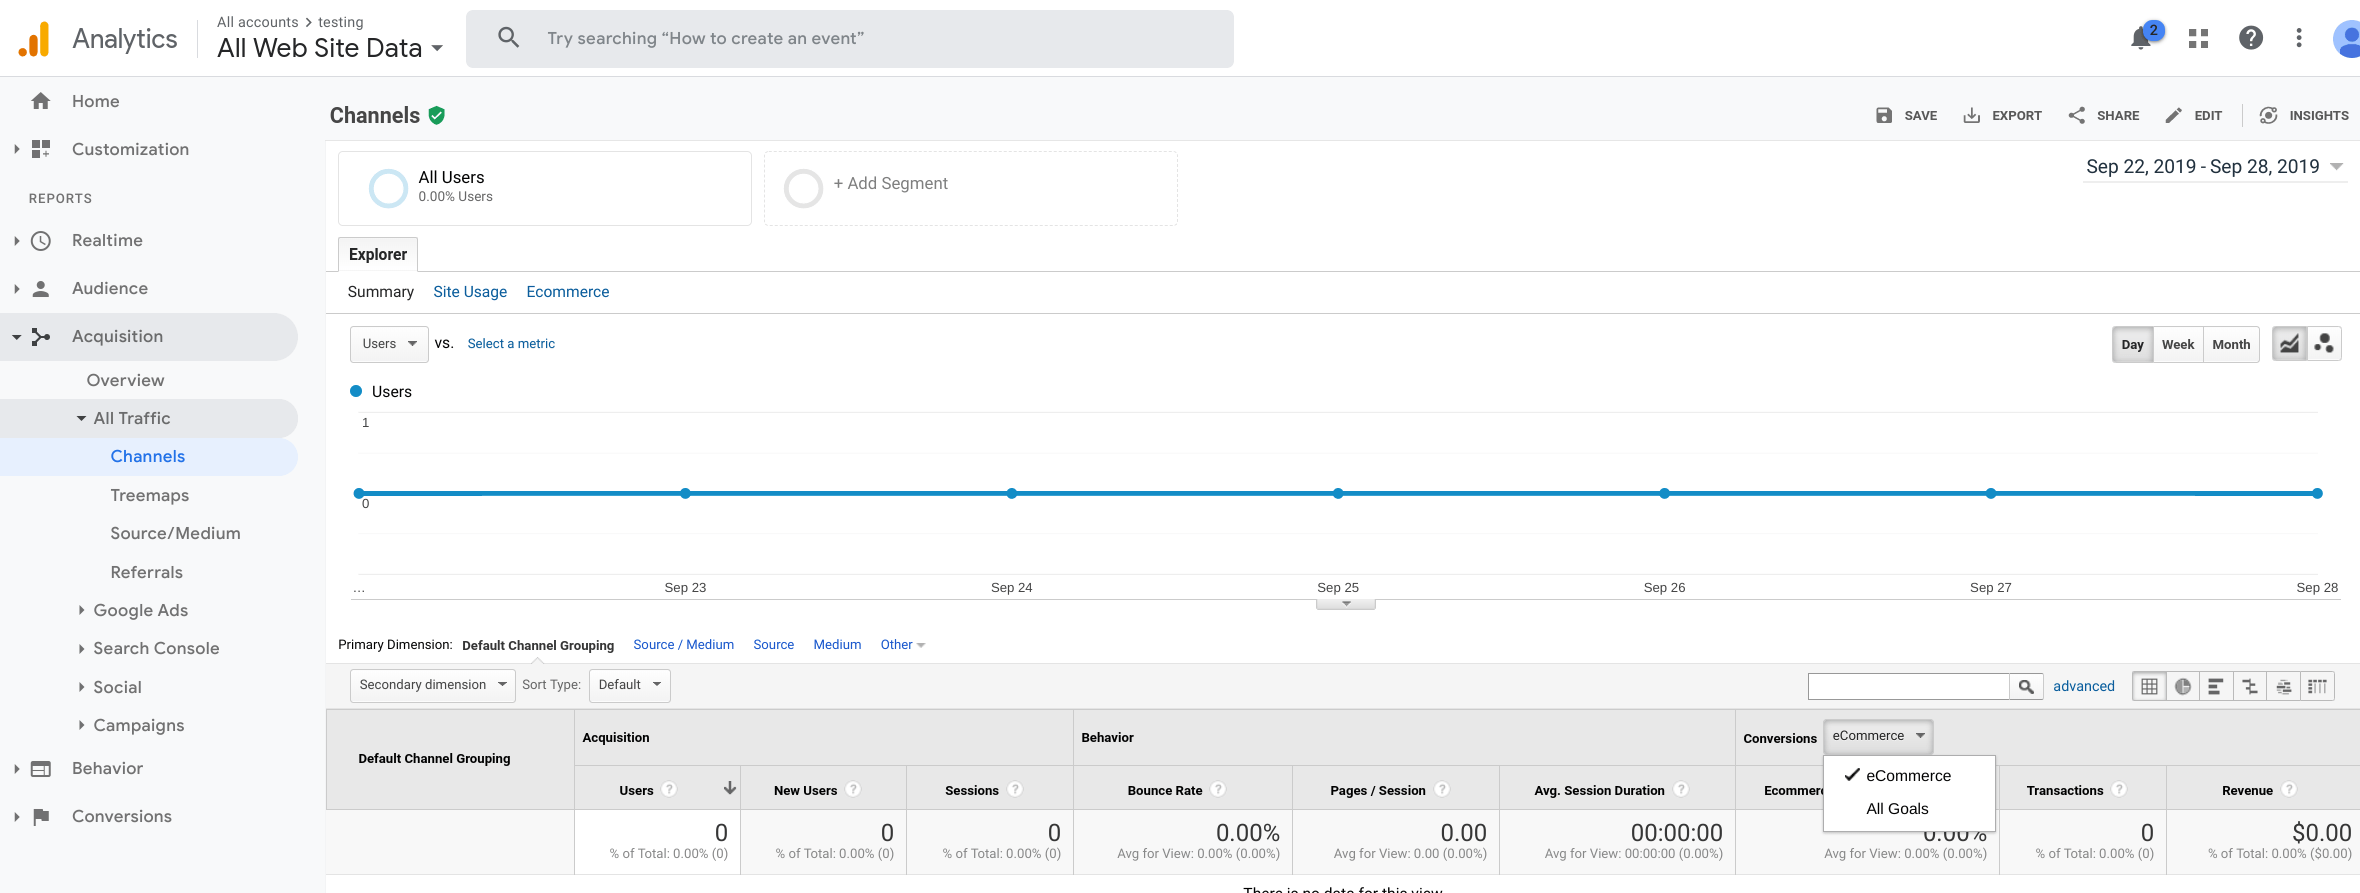
Step 8: Know through which channels people find you?
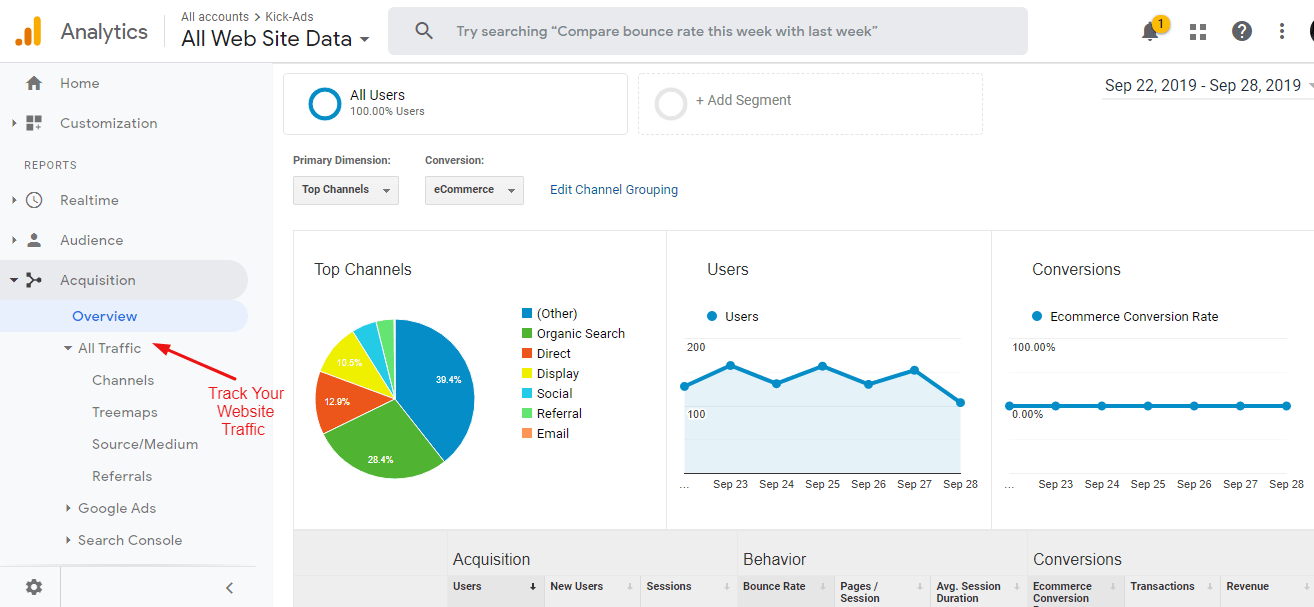
To know from where people are finding, you can help you finalize what you need to focus on to promote your business online and to decide your marketing strategies. To know this click on the Acquisition button on the left, it will give you a drop-down menu with the options Overview, All Traffic, Google Ads, Social, Search Console, and Campaigns.
In the overview, you will get a picture of the significant channels from where your visitors are coming from, e.g., whether they came to your site by entering your URL, landed here through social media, organic search or any other channel.
For more information, click the option All Traffic. This will divide the info such as how many people visited your site from each channel, and their details of the visit, such as bounce rate, pages per session, goal conversion, etc. Here also you can select a date range to see all this information in a specific time range.
On clicking Google Ads, you will see how your campaigns are performing in the market and how much traffic these campaigns are generating. This will show you the traffic numbers and the details of what actions that traffic performed while being on your website.
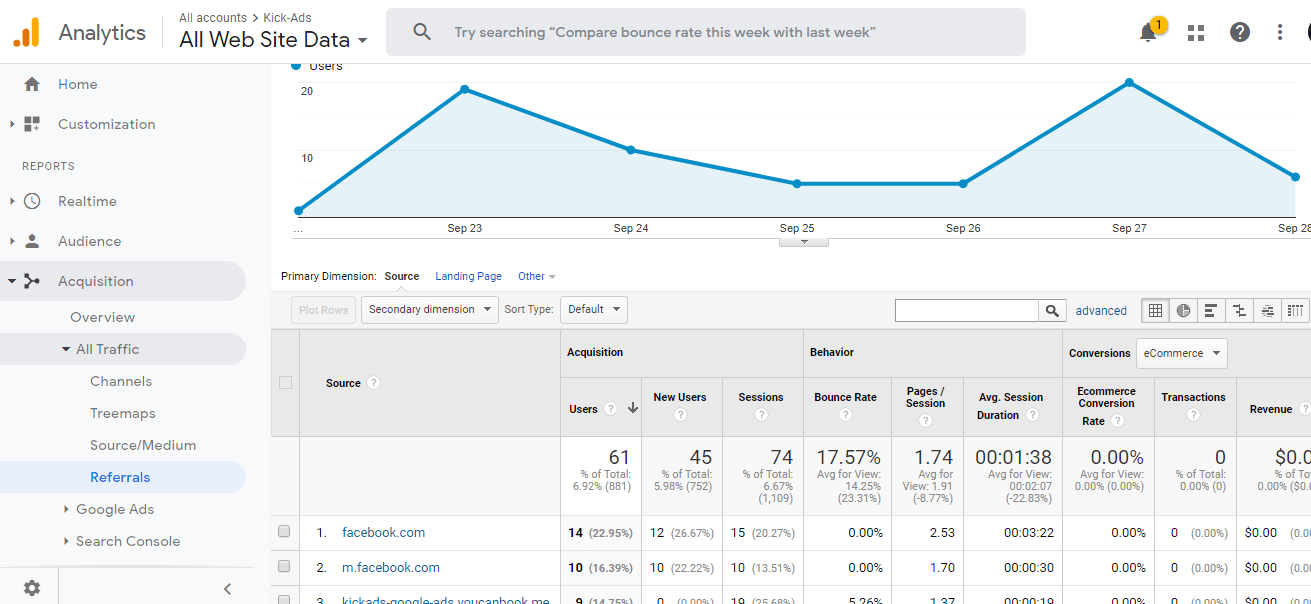
You will also see Referrals under All Traffic. This will tell you what websites bring traffic to you. This can become very useful if you have been doing link building for your site and want to see which sites have helped you in getting traffic. This section also shows you whole info like websites from which users came from, what they did on your site, sessions, bounce rate, pages per session, and average session duration.
You can evaluate how well your social media campaigns are performing by clicking on Social option. It will reveal how many users visited through the social network, how long they stayed on the website, how many pages they visited, and are they converted into leads or not.
Collecting all this information can help you in managing your marketing strategies and plans.
You can also use UTM builder to track individual campaign performance. For instance, you can use UTM variable within the links you post on social media to track the traffic of each post
UTM Builder: https://ga-dev-tools.appspot.com/campaign-url-builder/
Before investing your money on marketing, you should know how people behave on your site. Therefore you can boost the chances to bring new users and get them converted.
Step 9: Setting up Google Analytics Dashboard
As per google, dashboards are the collection of widgets that gives you an overview of your Google Analytics reports and metrics. Or you can understand it as a visual view of the most crucial information that you need to achieve your goals.
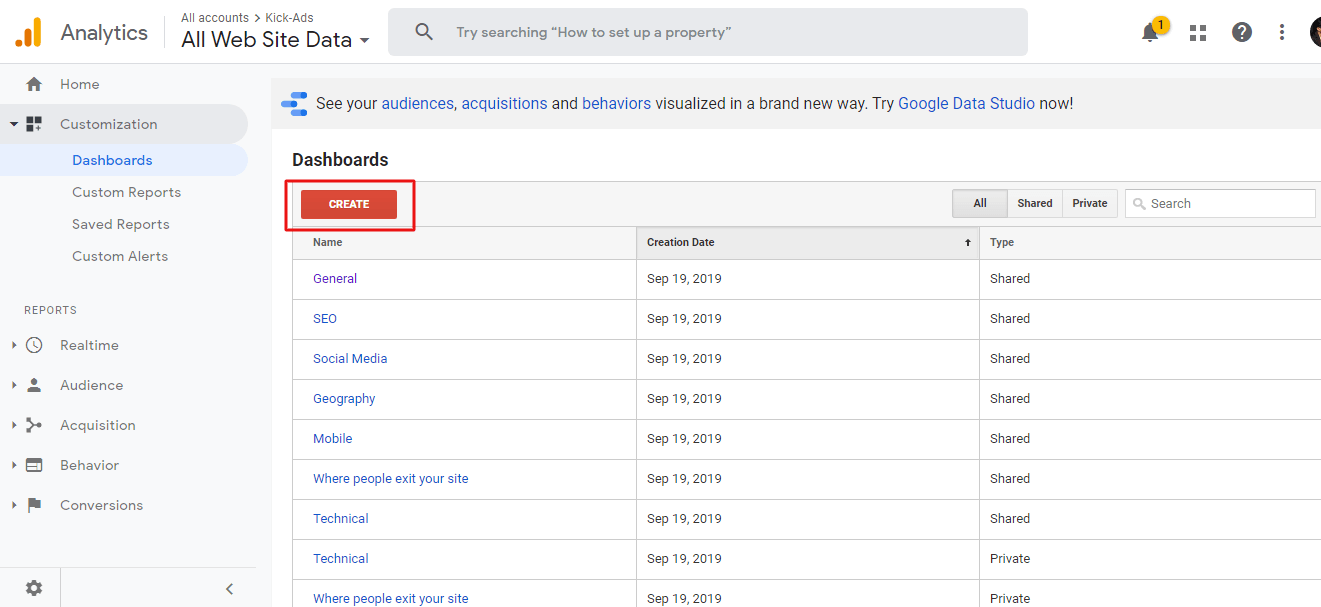
All this information appears on one screen so you can see all the data about your website. To find your existing dashboard, log in to your Google Analytics Account, and then click on Customization. Here you will see the Dashboards.
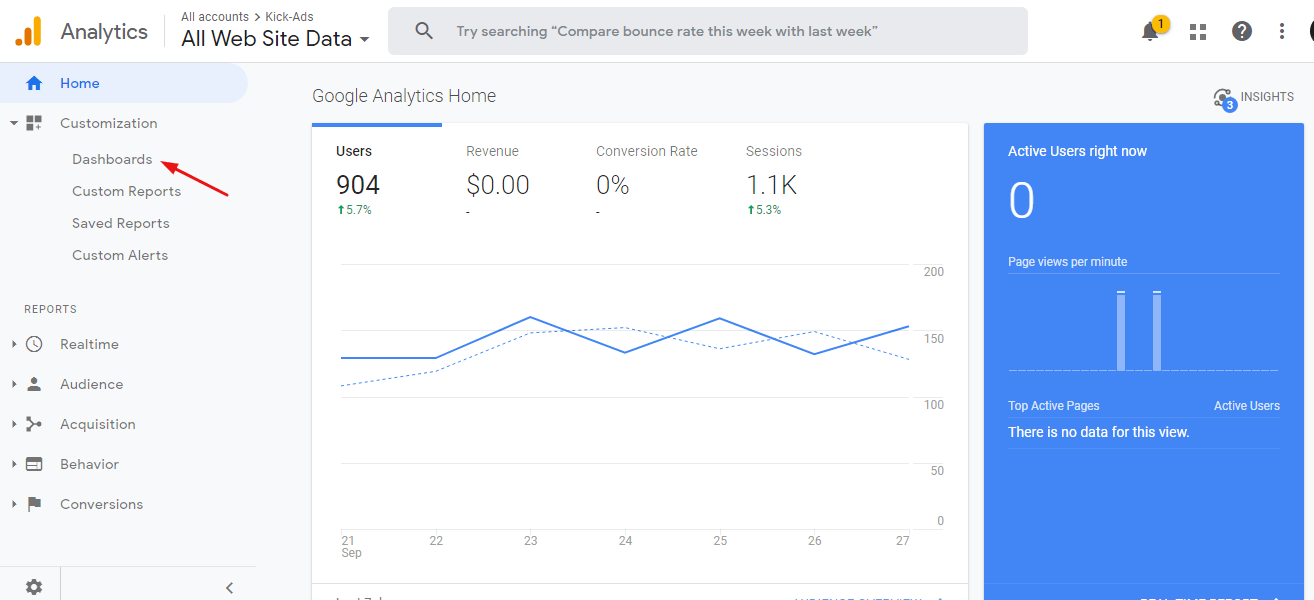
When you click, you will see the widgets you have added and the updated data in GA.
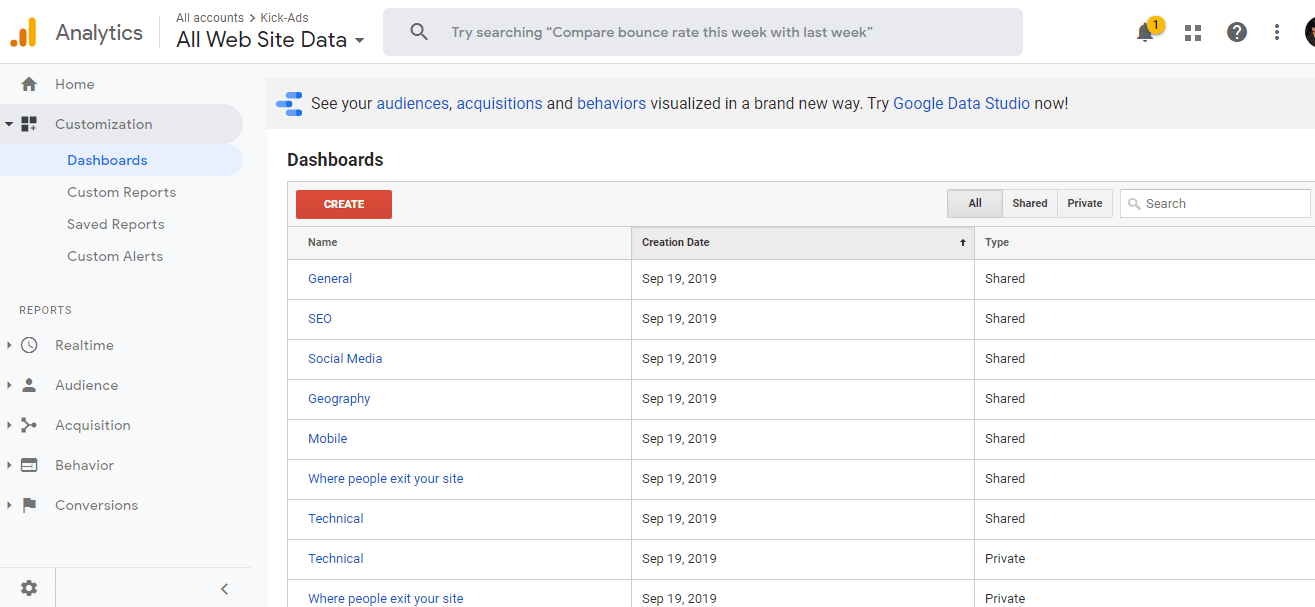
If you don’t have any dashboards, this section will be empty. Let’s explore how to create your own custom Google Analytics dashboard.
Creating a Google Analytics Dashboard
When you click on the Dashboard, you see an option of Create there. Click that button, and it will give you two options – Black Canvas and Starter Dashboard.
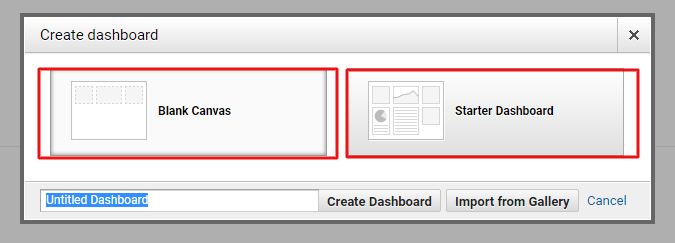
In blank canvas, you will not see any widgets, so you are free to add whatever you want. Whereas in the starter dashboard, there will be a default set of started widgets. This can be helpful if you have no idea about widgets.
You can also name your custom dashboard. Now choose one option and click on Create Dashboard. You will see your new custom dashboard in front of you.
If you really have no clue how to build a report, then you can also click on the option ‘Import from Gallery’ to download some common and popular reports build by others. You can learn a lot while building from scratch.
If you pick Starter Dashboard you will see all these widgets:
- New users
- Users
- Sessions
- Session by Browser
- Average Session Duration & Pages/Sessions
- Bounce Rate
- Goal Completion
- Revenue
In this, you can add more widgets like returning users, top countries, posts, and referral sources.
Let’s move to Blank Canvas and how to create a customized Analytics Dashboard using this template.
Creating a Custom Dashboard in Google Analytics
If you choose the Blank Canvas, you can name your dashboard and click on Create Dashboard.
Here you will see a popup of adding widgets to your dashboards. You can add one or more widgets:
- Metrics
- Timeline
- Geomap
- Table
- Pie
- Bar
Some of the widgets can show you the real-time data which can benefit you in many ways. Timeline, geomap, table, and counter widgets are the ones that can provide real-time data.
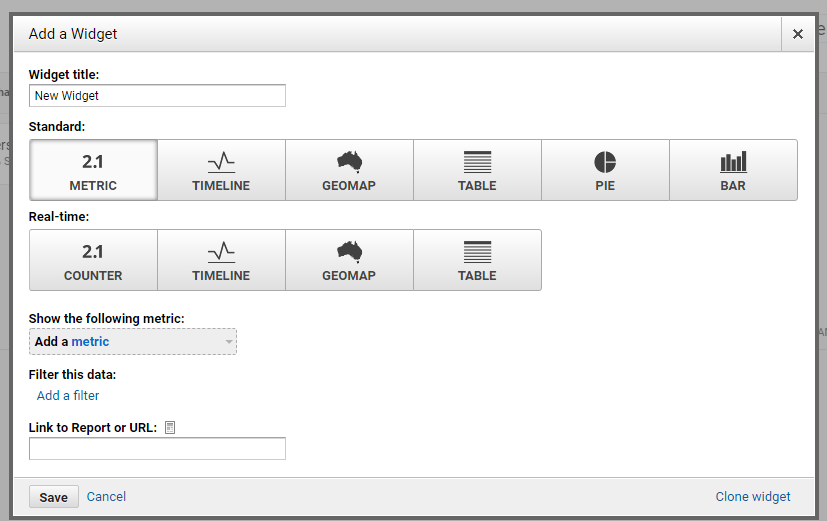
So these are the widgets that you can add to your custom dashboard. Now let’s add these to your dashboard. Let’s start with Metric and give the title name as Users, and it helps you to know precisely what kind of data to collect. You can add another widget also such as to filter your data use the Filter feature.
You can also edit a widget. Just hover the mouse on the widget and click on the edit symbol. To delete a widget here, you will also see a cancel symbol. You can also create a clone of a widget using the Clone Widget link.
If you have customized your widgets as per your business requirements, click on Save. After saving the information, you will see your widgets added to your custom dashboard.
Now you know how to create a default dashboard and a custom dashboard. You can utilize your dashboard to make a critical decision for your business.
To create insightful Dashboards, you need to at least have a basic understanding of GA on Dimensions and Metrics, Feel free to check the Document from Google: https://ga-dev-tools.appspot.com/dimensions-metrics-explorer/
See what Dimensions and Metrics you can leverage!!!
Step 10: Check whether your Google Analytics is Working Well or Not
In the end, do verify that after installation whether Google Analytics is connected with the website, and is working as expected. The simplest way to check is to go to Google Analytics then ‘Real Time’ and click ‘Overview’. If your Google Analytics is connected to your website, you will see a bar, and if not, then you should check what’s wrong.
Or you can also use Tag Assistant Extension to see if your code is implemented on the website correctly. This extension will help you in troubleshooting the installation of various Google tags, including Google Analytics, Google Tag Manager, and more. Tag Assistant helps in verifying that you have installed various Google tags accurately on your page. Just go on any page, and this extension will tell you which tags are present, report any errors we find and suggests enhancements that should be made.
Summing it up!
With this guide, you can successfully set up Google Analytics. You also get to know how you can leverage Google Analytics and what can you do with this amazing tool. GA is full of information that you can use to improve your website and can attract your users.
Google Analytics develops your understanding of what your users are doing on the site. Google Analytics is the most important tool for anyone who wants their marketing campaigns to be successful.
We hope you enjoyed this beginner’s introduction to Google Analytics. In case of any queries and questions, do not hesitate to reach us. We will be happy to help you!


